I developed and implemented a comprehensive metrics reporting system that provided quarterly snapshots of departmental performance across instructional design, eLearning delivery, and facilitation operations. This Q2 2017 dashboard showcased our ability to maintain exceptional quality at scale, with key achievements including:
Customer Satisfaction & Quality: Achieved 93% satisfaction rate (Very Satisfied and Satisfied) for eLearning modules, with learners specifically citing the visual, interactive, and easy-to-use nature of our training as top strengths.
Scale & Reach: The training department delivered 64,500 course completions to 26,000 unique learners across 1,100 facilities through our partnership with HealthStream, demonstrating significant market penetration with major healthcare systems including Ascension, Kettering Health Network, and Tenet HealthCare Corporation.
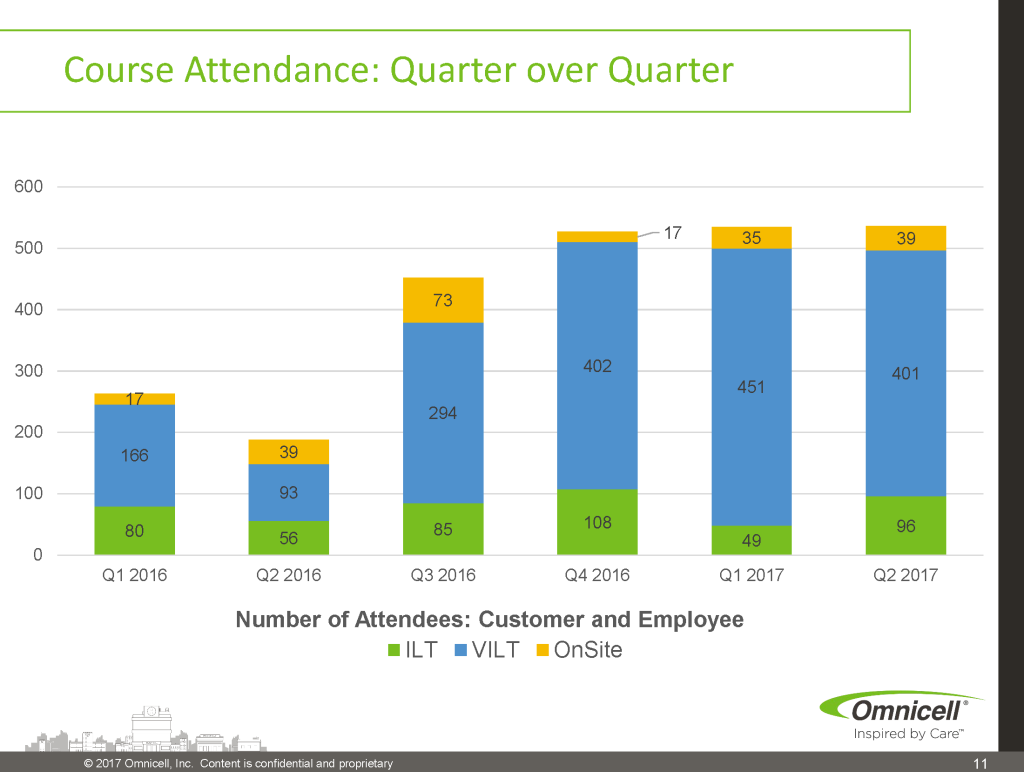
Growth in Facilitation: Attendance increased to 536 learners in Q2 2017 (up from 452 in Q1), with facilitation hours reaching 1,300 hours—a 24% increase quarter-over-quarter. This growth was achieved while maintaining the 40% facilitation goal and strategically balancing instructor time across facilitation, course development, and customer support.
Resource Optimization: The metrics demonstrated effective resource allocation, with instructional design team maintaining 79% focus on course development (exceeding the 70% goal) while supporting multiple product lines (Medication Adherence, Supply, MTS, OptiFlex, and IMS).
This transparent, data-driven approach to reporting established credibility with senior leadership and provided the foundation for strategic resource planning and investment decisions in training operations.


